Plot2D
From SAXSutilities wiki
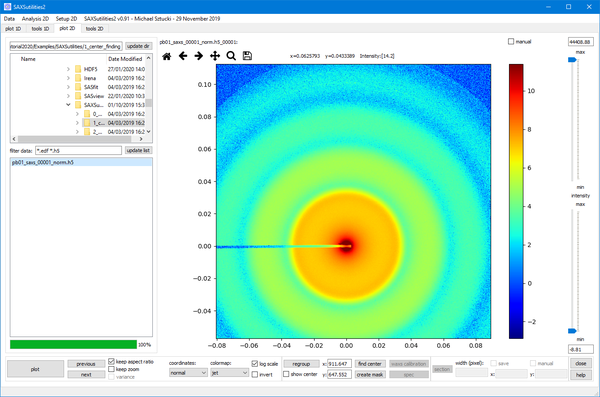
Plotting of two-dimensional images in HDF5 (Dectris and various ESRF flavours) or EDF format. Procedures for creating software masks, finding of beam center, WAXS distance calibration, etc. can be accessed.
Contents
Features:
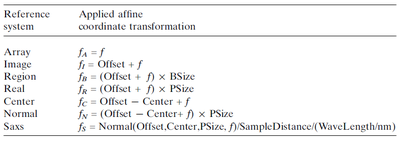
- Support for different coordinate systems:
- Multiple images and composite images can be plotted simultaneously (details see below).
- You can also loop through images with 'previous' and 'next' buttons and activate automatic display of successive pictures from the menu ('continuous playback').
- Procedures for creating software masks, finding of the beam center coordinates and WAXS distance calibration can be accessed (details see below).
- Horizontal and vertical cuts can be generated and saved.
- Saving of thumbnails of the scattering images is possible from the menu. This can be automatized for an entire directory by checking 'autosave thumbnails' and 'continuous playback'. Then click on 'next' button to start plotting and saving.
- A routine for more detailed peak analysis (center, FWHM) - also of image series - can be accessed from the menu.
- Zooming, panning and saving of the graphs is possible by the buttons above the graph window.
- Metadata which are not specified in the data files can be predefined in the menu ('metadata defaults'). Metadata written in the files will always overwrite these standard values, if present.
Specific Features:
In the following a list of functions with more detailed description:
MULTI-PLOT -- COMPOSITE
Multi-plot option:
- By default, plot2D will plot one picture at a time. In case of selecting several files, a multi-plot of up to 20 images is created.
- NOTE: in this case only the first image of an image series will be considered !
- NOTE: the ordering of the imgages is not in alphanumerical order, but in the order images have been selected ! Please, refer to the header of each individual image to identify which image has been plotted.
Composite option:
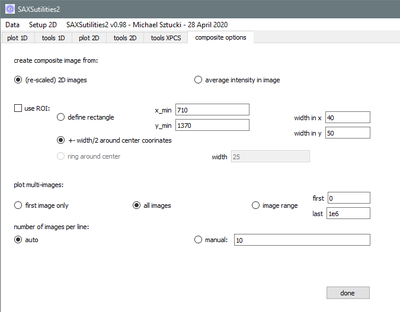
- This option can be chosen and configured from the menu.
- It is possible to either create a composite image of (re-scaled) 2D images, or plot the average intensity of each image in one pixel. In the first case, the images are automatically binned in order to keep the array size of the composite image reasonable. The binning factor is plotted in the header.
- It is also possible to define ROIs.
- The number of images per row can be specified manually.
- The composite image is the (only) way to plot image series (saved in one file) simultaneaously.
- A range of images can be defined in this case.
PEAK ANALYSIS
- Peak analysis is available from the menu and allows determining the FWHM and center coordinates of one peak per image.
- It can be applied to image series, the results are written to a file in the current directory.
SECTION
- Horizontal and vertical sections are calculated.
- Their crossing point is either chosen by clicking in the graph or manually by defining the center coordinates. The chosen coordinate system is taken into account.
FIND CENTER
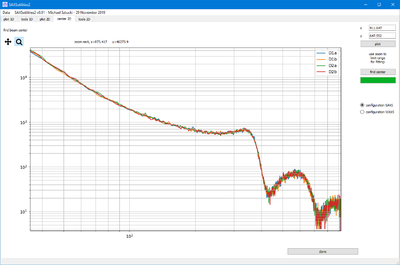
- This routine creates four diagonal cuts (for SAXS) starting from the presumed beam center.
- An optimization routine, refines the center coordinates to best overlap these cuts.
- Note: To activate the optimization, you need to zoom into the range which should be cosidered for fitting.
- Dead areas of pixel detectors are normally ignored, but all four curves must be visible over the full chosen q range (important when beam center is close to the border of an image).
CREATE MASK
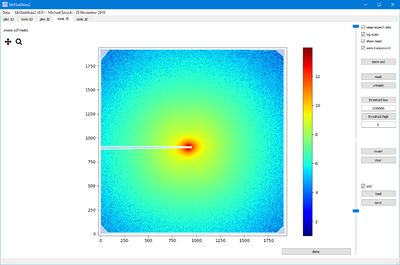
- Routine for creating software masks.
- Files are always written in edf format.
- The 'add' checkbox allows to combine several masks, e.g. an imported mask of the dead zones of an detector plus a threshold mask.
WAXS CALIBRATION
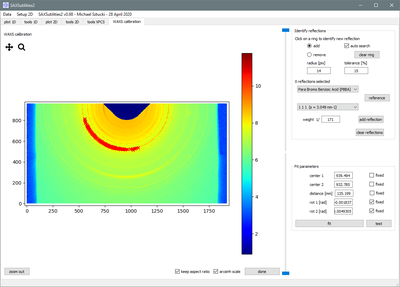
This routine helps to calibrate the sample to detector distance at close distance (WAXS) by identifying known diffraction rings. Procedure:
- Click in image on diffraction ring. The sofware tries to identify more points on the diffraction ring by calculating rings with a predefined radius around each calculated point. Note: this automatic procedure can be deactivated by un-checking 'auto-search'.
- A second click on the same diffraction ring will be additive.
- If unwanted points have been marked on the image, these can be now removed: click on image with checkbox 'remove' selected.
- Choose material and reflection.
- Click 'add reflection'.
- Continue with point one for at least two reflections.
- Verify that the start parametrs of the fit are reasonable.
- Click 'fit' to start fitting.
- Click 'test' to verify result (the rings should be now represented as vertical lines).
